Making mbTiles
This page explains how to make your own CMap and Navionics navigational charts for OpenCPN, as well as how to augment
your charts with extremely high quality satellite imagery. The tools and data are all free on the internet, so all you have to add is time and
internet bandwidth and a Windows computer. I've tried to write this page so even a novice can make high‑quality charts,
so if there's something you don't understand, please contact us.
We cover the following subjects in this article:
This article will attempt to explain, even to a novice, how to make your own high‑quality navigational marine charts
for OpenCPN (or any navigation program that reads mbTiles) using satellite imagery from ArcGIS, Bing (Microsoft),
Google Earth, Nokia, and others, as well as marine charts from Navionics and C‑Map. We'll take you through what
programs are needed, how to install them, and how to set them up. Then we'll explain how to make your first
high level overview charts, how to load them into OpenCPN, and
how best to display them so you can switch between them with a single keystroke. Then you'll be all set up to
make your first navigational charts. But the real object of
this page is to show you how to automate much of this, so your computer can make you extremely detailed charts for your entire
cruising grounds easily. And the icing on the cake is that the tools and the data are all free! Along the
way we'll attempt to explain some of the concepts, provide some tips, and we'll end with some more
advanced topics that aren't necessary, but could be interesting.
Recently updated charts of North America and Europe are often pretty good, but even they don't give the sort of
detail or accuracy that satellite imagery can. And charts for much of the rest of the
world, and especially in SE Asia where we are now, are universally horrible. Features are often displaced from where
they're supposed to be, and the commercial charts often lack detail, especially once you get off the beaten
track. Remember that they're made primarily for cargo ships.
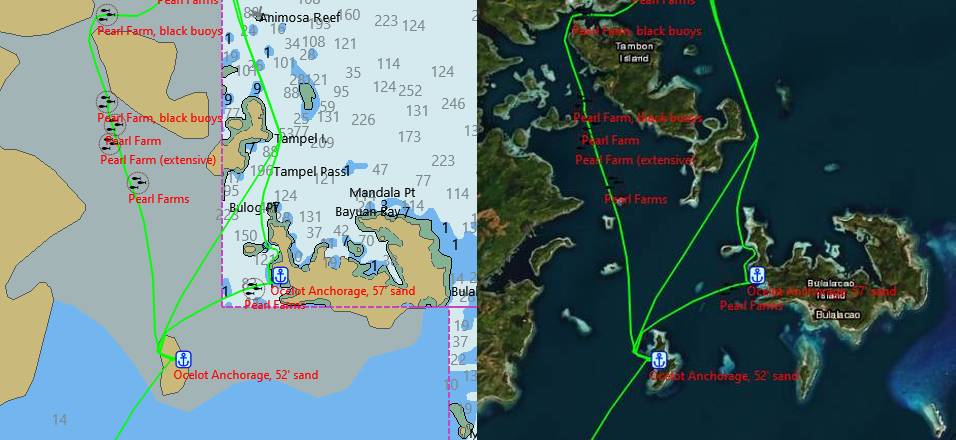
The exact same area of the Philippines. Which chart do you want, CM93 or Bing?
Note especially our southern anchorage, & how the island is displaced in CM93.
|
We've been augmenting our charts with satellite imagery since 2014. The geo‑registration of satellite imagery
is amazingly accurate, with maximum errors on the order of 10 feet, or 3m. They'll show you which slip you're in
at the marina, or exactly where that coral head is that you have to dodge to get into that perfect anchorage. They
don't always show everything, but where they show something, that's exactly where it is.
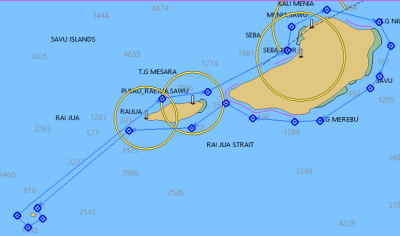
Closed route around 3 islands |
Well, yes, it is, and I'm sorry if it looks a bit scary. Mostly it's because I want even novices to be able to make
their own charts, so I try to explain all the steps as best I can. However, once you get your system
set up, the workflow is actually pretty simple:
- Use OpenCPN to draw routes along the coastlines, and around archipelagoes or shallows
- Name and export those routes to a folder
- Tell Sat2Chart where that folder is and which routes to work on, as well as:
- What zoom levels you want in your mbTiles (we use Z10-18)
- Which maps you want mbTiles of (Bing, Google, ArcGIS, Nokia, Navionics, CMap, etc)
- How far on each side of your routes you want imagery for (we use 4nm)
- Let Sat2Chart & SAS start cranking away.
|
There are some minor extra details, but that's basically it. So please don't be put off by the length of this page.
The imagery is stored on the websites of the companies involved (ArcGIS, Bing, etc). It comes to us via a free and
Open Source Russian program called SAS Planet, which knows how to access the data on those websites. As of 2021, SAS provides FREE access to imagery from ArcGIS (which is
fabulous, and usually quite expensive), Bing (Microsoft), Nokia (also Microsoft now), Google Earth, Yandex, MapBox,
Maxar, OSM, and a host of others, as well as 2 flavors of Navionics marine charts and 5 flavors of CMap marine charts.
SAS is part of the Open Software Foundation (like OpenCPN). Having used it now for a few years, it seems pretty good.
SAS stores everything it downloads into its cache on your hard drive, so it's available for offline use (and for making mbTiles).
You can mark out an area and tell SAS to download all imagery (tiles) in that area, at whatever zoom‑levels
you choose, and it will happily grind away downloading and storing the information by itself. It can also take a GPS
input to show you where you are, and it can import, display, and export GPX data (routes, waypoints, tracks, etc) so
it's almost a navigation program in its own right. When cruising, we typically run both SAS and OpenCPN side‑by‑side on a 17" laptop,
with a serial‑port splitter to feed the GPS signal to both programs.
OpenCPN, with its ability to
display mbTiles, is available for many operating systems: Windows, Mac, Linux, Raspberry Pi, Android ($15),
etc, but not iPads or iPhones as of 2023. However, the programs needed to make mbTiles,
SAS Planet and Sat2Chart, are currently Windows only. Some folks have been able to run them in a Win10
emulator, but that goes beyond the scope of this article. So anyone with a mainstream computer should be able to
use mbTiles, but Windows is required to actually make them.
Sat2Chart can make either KAPs or mbTiles. KAPs are a MapMedia format that's been around for years, and we've been
using them since 2015. MbTiles are a newer database based format for storing map‑tiles. KAPs are limited to
128 separate colors, much like the old CompuServe GIFs. This turns out to be important when scrutinizing a
coastline looking for minute differences in the shade of blue that might show an anchorage. MbTiles don't have a
color limit, so the color quality is much better. And mbTiles have other advantages...
For the purposes of this article, I'm going to assume that users are planning to display their imagery in
OpenCPN,
the open‑source (free) navigation program used by many cruisers these days. KAPs are essentially a single picture,
taken from whatever altitude you choose. For OpenCPN to display this image at a different altitude (zoom level) it has
to decide which pixels to keep and which to throw out. This can put a huge strain on its display engine, especially
when panning around with many KAPs displayed. So much so that we typically switch to our CM93 charts when we want to
pan to somewhere else, and then switch back to our KAPs only when we're displaying our new area of interest.
MbTiles, on the other hand, can have multiple zoom levels stored in the single file. This makes it easy for OpenCPN, as
all it has to do is extract the correct zoom level from the mbTile and slam it out to the display engine. We find panning
with mbTiles displayed is slightly slower than with our CM93 charts, but not badly so, and we're quite happy moving
around with mbTiles displayed.
All programs (and data) are free on the internet. While only SAS Planet is strictly necessary, the others offer
distinct advantages, especially for making (and using) multiple mbTiles in multiple maps.
- OpenCPN. Used for navigation,
planning trips, displaying mbTiles, and for creating the routes to feed to the Sat2Chart
automation engine. You need at least version 5, and the later versions improve performance.
- If you don't already have the CM93 charts, you can
download a 2007 copy from
Terry Sargent's page (now
hosted on Soggy Paws' website). Unzip them first to a \CM93 folder, and point OpenCPN there during the install process.
The CM93 charts aren't very accurate at all, but they make a reasonable base‑map for your mbTiles, and they load
very quickly.
- Sat2Chart. The automation engine that
creates multiple mbTiles for multiple maps, created and maintained by Paul Higgins. Do NOT install Sat2Chart to
your C:\Program Files folder. Let it install to its own C:\SAT2CHART folder. Once it's installed,
we like to find the Sat2Chart.exe program, right‑click on it, and pin it to the task‑bar so it's easy to find and start.
- The end of the installation process invites the user to Start Sat2Chart, but don't
do that just yet. Before starting Sat2Chart, you need to install 2 prerequisite programs. These can be
installed from Paul's server. The
ooRexx interpreter (32‑bit
version, not 64‑bit) and the GDAL graphics
package. Once they download, install them with the normal defaults. Once they're installed, you can
start the Sat2Chart program.

If you get this popup, click More info, then Run anyway |
- Note that these programs aren't common, so Win10 sometimes warns you not to install them after downloading
them. If so, you have to click the "More info" link and then a "Run anyway"
button appears at the bottom of the dialog.
- The direct links above worked in 2021. However, if things have changed, then go
to Paul's server and look for the correct versions to download.
- If Sat2Chart still won't run, go to the Help/English folder under where Sat2Chart
is installed and double click on Index.html. This will bring up Help in your browser. Read the section on
Installation, and especially Prerequisites, to get everything setup correctly. If you still have problems, you can go to one of the Help
forums listed below in the Help and Support section.
- SAS Planet. For making mbTiles,
it's best to use the version from Paul's server,
as it's preconfigured. SAS comes as a ZIP file. You can unzip it where you like. But the cache is
likely to grow quite big, so put it on a drive with a lot of free space.
- We create a D:\SAS\SAS_for_Sat2Chart folder and install it there, because
we also have a D:\SAS\SAS_for_Nav installation, with BOTH installations using the same D:\SAS\Cache_SQLite cache
(we talk more about this in the Advanced Options section at the bottom
of this page).
- We also like to go into the SAS folder, find Sasplanet.exe, right click on it, and pin it to the taskbar, so it's easy to start.
Sat2Chart Help
|
You're now ready to become an mbTile factory! While you can download imagery and make mbTiles with just SAS Planet, the
Sat2Chart program automates much of the work, and applies it to multiple maps in turn, all automagically. Sat2Chart is
the follow‑on to Paul's old GE2KAP program that he started back in 2014. GE2KAP was limited to using Google Earth
(only) and making KAP files (only). Now we use SAS Planet instead of the GE program, and mbTiles have several advantages
over KAPs.
Most of these are optional, or will already be set, so this is mostly just to verify settings.
SAS Planet:
- As downloaded from Paul's website, SAS is already pre‑configured to work with
Sat2Chart. You can safely put it where you like, and you can rename the folder it's in.
- If you're using a different installation of SAS, then open Sat2Chart, press the
Help button in the lower left, and read through the SAS section to setup your SAS correctly for Sat2Chart. Note
that, while this is possible, we don't recommend it. Better to have 2 installations of SAS. This is
what we do (see the Advanced Options section at the
bottom of this page).
- Play with SAS a bit, to get used to it (you'll need to be connected to the internet). You should be able to switch between maps
with just a single keystroke: A=ArcGIS, B=Bing, G=Google Earth, N=Navionics, etc. Click on the map and drag
your mouse to pan around to different areas of interest. Zoom in and out with your mouse‑wheel to check out
details, especially on some reefs. See how well the maps agree by switching between maps when you're zoomed
in. The satellite imagery can be pretty amazing, especially in the tropics.
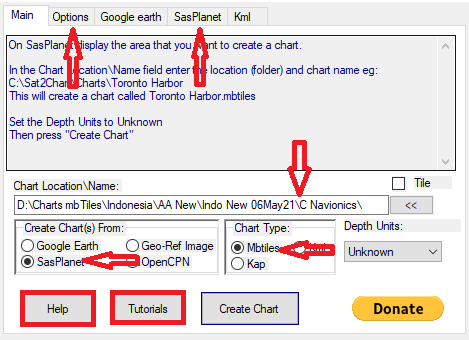
Sat2Chart main page settings |
Sat2Chart:
- Paul has put a lot of effort into his Help section. It's probably a good idea to read through that,
or at least, to skim it, so you know what's going on. His video tutorials are also valuable.
- On the main page, set "Create Charts from" to SAS Planet.
- Set the "Chart Type" to MBTiles.
- Leave the Depth Units set to Unknown.
- Set the "Chart Location\Name" to the folder where you want the mbTiles put when they're finished (or you can set this later).
- On the "Options" tab, set Diagnostic level to 0, and check "Field and Buttons Tips" to get mouse‑over tool tips.
- On the SAS Planet tab:
- Set the location (folder) where your SAS Planet is installed.
- Make sure "Invoke SAS downloads" is checked.
- Check "splits" and set the number to about 20, depending on your internet quality (higher for better)
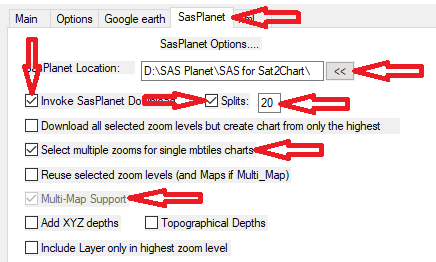
Sat2Chart SAS Planet Settings |
- Check "Select multiple zooms for single mbTiles charts" and "Multi‑map support"
- I set my MbTiles Creation to SAS Planet, mainly because I make huge mbTiles. Having
Sat2Chart make them is more robust, but takes longer and has some limitations for large mbTiles.
OpenCPN:
- You should go through the Options dialog (looks like a gear on the left) to make sure things are set the way you want them.
- In Display/Advanced, make sure "Use Accelerated Graphics (OpenGL)" is checked. It's necessary for displaying mbTiles.
- In Ships/Routes/Points, make sure "Lock Waypoints (unless waypoint property dialog
visible)" is checked. This will save you from accidentally moving a waypoint as you pan around a map. If you
want to move a waypoint, simply double click on any waypoint to bring up the properties dialog, move it out of
the way, and then move whatever waypoints you want.
- As shipped, OpenCPN only includes tide stations for a few areas. To get more worldwide tidal data,
download this zip file,
unzip it, and copy the 2 Harmonic files to C:/Program Files (x86)/OpenCPN/tcdata, replacing the 2 files
already there. You'll need to provide Administrator authorization for this (click Continue when asked).
If you'd like full instructions with copious screenshots, you can download
Terry Sargent's Word document.
- Click the 3 horizontal lines in the lower right corner (the "hamburger") and make sure all settings are what you want.
- I like to use Look Ahead Mode, which keeps most of the chart ahead of your boat.
- Make sure Enable Chart Quilting is checked
- Under Vector Charts, make sure Show Text and Show Depths are both checked
- Click the 3 horizontal lines again to close the dialog
- Optional:
- If you can attach your OpenCPN computer to your AIS output, you'll get not
only GPS, but AIS information as well. OpenCPN does an excellent job of displaying AIS targets, and it has
a very flexible AIS alarm system as well. Remember that AIS comes in at 38,400 baud, unlike normal GPS
data, which usually comes in at 4,800 baud.
- You should go to your Plugins and click the Update Plugins Catalog Master in the lower left. Then you can select which plugins you want to enable.
- I like my personal marks to stand out, so I set their text to be red. Go to
User Interface, click the down‑arrow at the end of AIS Target Name, and select Marks. Then click
Choose Font and set the Color to Red.
- In Options/Ships/Routes/Points, I like to set my "Show waypoints only at
a chartscale greater than 1:" 1,500,000 (or whatever scale you want so the clutter goes away when you zoom out).
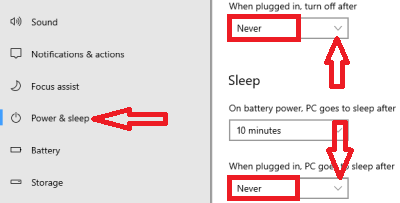
Windows power settings |
Computer:
- Your computer may be working on downloading imagery and making mbTiles for hours
at a time. You want to make sure that your computer won't go to sleep, or even turn off its screen, while it's
working. Since you won't actually be touching your computer while it works, it will want to.
- Go to Settings (looks like a gear), System, Power and Sleep. You can leave the
"on battery power" settings as you like, but under "when plugged in" set the Screen to Never, and set the
Sleep to Never. You can then close the Settings dialog.
There are some different schools of thought regarding how and where to make mbTiles. Some folks study the charts and
pick out anchorages ahead of time, and then only make mbTiles for those areas. This can save a tremendous amount of
download time and disk space. But we never know where we're going to end up, and we really don't want to find ourselves
somewhere without good charts. Also, we provide our mbTiles for others to download, and we certainly don't know where
they're going. So we take more of a shotgun approach, and gather pretty much the entire coastlines of the places we
want to sail to. This obviously uses more disk space, but disks are pretty cheap now. It also takes more time and more
internet bandwidth, so we tend to make most of our charts when we're in the US, where internet speeds are high and usage
is unmetered. We also let the computer do its work at night, while we're asleep, which is part of the joy of using
Sat2Chart. For us, knowing that we have good charts for everywhere we might end up is worth the cost in peace of mind.
We also make our mbTiles with all zoom levels from 10‑18. This makes it easier for OpenCPN to display them. If you put
in just a few zoom levels, then OpenCPN has to decide which zoom to extract, and which pixels to throw out and which to
keep, which can put a strain on the display engine. Remember that each higher zoom level is 4 times as big as the last,
so including lesser zooms doesn't cost much. Two thirds of the data (imagery) in your mbTile will be from your highest zoom.
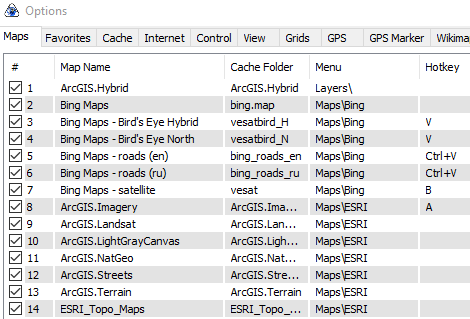
Some of the 370 maps available via SAS Planet |
The short answer to this is that we currently use: ArcGIS (A), Bing (B), Google Earth (G), CMap (C, D, or J), and
Navionics (N). However, there are several other good maps that we haven't explored yet (Nokia, Yandex, MapBox, Maxar,
OSM, and several others). Some of these are better in some locations than others.
SAS has the concept of Layers, where pure satellite imagery from, say, Bing, can be over‑layed with place‑names from,
say, Google. There are LOTS of potential combinations, including overlaying the oceans of satellite imagery with
Navionics or CMap (which doesn't work very well). We tend not to use either of these, but you might want to
explore them a bit. We find that bits of name text from one zoom sometimes bleeds through to other zooms, leaving
fuzzy letter scraps littering the chart that you can't easily get rid of.
All of the data that SAS Planet presents (maps) are actually housed on other servers, belonging to Microsoft, Google,
Navionics, etc. The maps that are available through SAS, and the mechanisms SAS uses to access them, are constantly changing.
So much so that recent versions of SAS include an UPDATE.CMD file in the Maps folder to refresh the list of maps, their organization, and how SAS can access them.
If you find that a map you've been using is no longer available, or not working, sometimes running that UPDATE.CMD file
will get it to work again. However, the SAS shortcuts to their maps are defined in these map definition files that
get updated. Running this Update file
will reset your personal SAS shortcuts to those maps, so be prepared to set them back if you update your charts. Usually, any
necessary updates will appear on the Facebook support forum
and can be poked in manually.
As of 2021, Paul's version of SAS includes CMap, but if you update your maps you'll lose the ability to access CMaps at all. See the C‑Map
Chart Data entry under the Advanced Options at the bottom of this page
for more, including how to preserve any CMap data you may have downloaded from before May 2021.
To make good quality mbTiles of the coast, it helps to know exactly where the coast is, as well as where rocks, reefs,
and shallows are, so you can include them in your mbTiles. This information is often missing from the CM93 charts. So
I'll often make some quick high‑altitude mbTiles of an entire area or even a whole country. These have too little
detail to use for navigation, but they're quick to make and they're much more accurate than the CM93 charts.
- In OpenCPN, center your screen on the country or coastline that you'll be working on.
- Click the Create Route button, or hit ctrl‑R, to start creating a route. Your cursor will turn into a pencil.
- Click on the chart to create a route that encircles your entire area of interest. If you're working on the coast of a continent, go a bit inland and
far enough offshore to include all off‑lying rocks or shoals. For somewhere like Tonga, make sure you
surround all of the islands you're interested in. Since you won't be downloading much detail, the area can be
quite large. I recently made overview charts for all of Indonesia, enclosing an area 1,000 x 3,000nm.
- To finish your route, click on your starting waypoint. You should get a popup asking if you want to use the nearby waypoint - answer Yes.
- If you don't get the popup, you missed the waypoint and need to try again until you do.
- Right‑click anywhere on the map and select End Route.
- If your route needs correcting, double‑click on any waypoint to bring up the waypoint property dialog.
Move it out of the way and then move any waypoints that need adjusting.
- To add a waypoint, right‑click on the line and select Insert waypoint, then move it to where it's supposed to be.
- To delete a waypoint, right‑click on the waypoint and select Delete. Do not just Remove from route.
- Double‑click on the route to bring up the route Properties. Give the route a name like "Mexico West Coast
CS2C" or "Tonga high level CS2C" and close the property dialog.
- I end my Sat2Chart routes with S2C or CS2C (Closed Sat2Chart) to distinguish them from normal routes.
- Open the Route & Mark Manager on the left (looks like 2 pieces of paper).

Sat2Chart dialog for .GPX input files and .mbTiles output location, with Merge in the corner |
- On the Routes tab, click on your route and then click Export Selected and tell it where to put the route, like D:\Charts\Routes\[country]. Remember the location.
- Minimize or close OpenCPN. Start and minimize SAS Planet, and start Sat2Chart (see screenshot at right).
- Click the << at the end of "Chart Location/Name" and tell Sat2Chart where you want the mbTiles put (like D:\Charts\mbTiles\[country])
- Click the << at the end of "Polygon/Paths" in the right pane and navigate to where your exported route is and select your route.
- If your Sat2Chart doesn't have a right pane, click the > at the middle of the right edge to pop out the right pane.
- Click the [OK] button in the popup to confirm your selection. You don't need to fill in a name, that will come from the name of the Route.
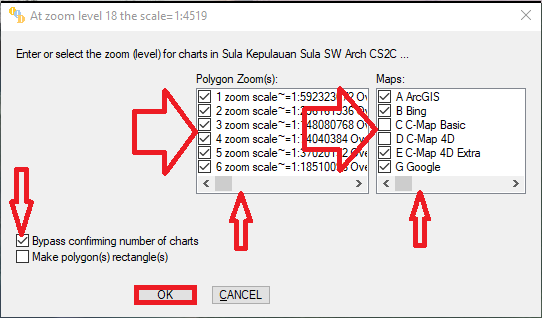
Sat2Chart Zoom and Map Selection dialog |
- Sat2Chart will bring up SAS Planet for a moment and then bring up a selection dialog. Select:
- The zooms you want (1‑12, use the slider at the bottom of the window to get more)
- The maps you want (like ArcGIS, Bing, Google, CMap, Navionics, etc. Again, use the slider to get to more.)
- Check the Bypass confirming number of charts box, and then [OK]
Sat2Chart will think for a while, converting the Route (.GPX) file into a .HLG file for SAS Planet, and then it will
put SAS on the left side of the screen, itself on the upper right, and tell SAS to start downloading content for the
first map. When it finishes, it will make an mbTile from the downloaded content and tell SAS to go to the next map
so it can do it all over again. When it finishes all of the maps you've selected, it will sound a Ta‑Da and show
some statistics for the run.
The mbTiles will all be in your destination folder, with names that look like:
[Route name].[map name].[zoom levels].mbtiles
Once you load your overview mbTiles into OpenCPN, you should be ready to make your navigational mbTiles!
Is this useful? Buy us a beer!  |
|
To use your mbTile charts in OpenCPN, it helps if you split them into chart groups, so you can switch between
them with just a single keystroke. While putting them in Chart Groups isn't strictly necessary, it makes working
with your mbTiles MUCH easier.
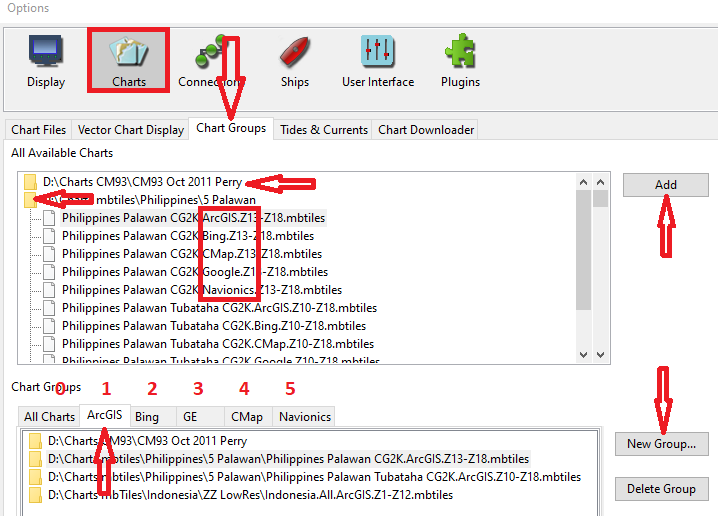
OpenCPN Chart Groups dialog |
- Open Options (looks like a gear) and go to the Charts tab (2nd from the left).
- Click Add Directory and add the directory of mbTiles that you're interested in. You can add multiple directories.
Note that if you add a directory, OpenCPN will include all subdirectories under that point (which is why you only
have to point to the top of your CM93 folder). If you're not careful, you can overload OpenCPN with too many charts
if you point it to the root of a large network of charts.
- To make it easy to flip between maps with just a single keystroke, go to the Chart Groups tab.
- Add a new group (bottom dialog) and name it, for instance, ArcGIS
- We always put our CM93 charts into each group (select CM93, click Add) but this is not strictly necessary.
- Double click your mbTiles folder(s) to expand out which mbTiles are in them.
- Select all of your ArcGIS mbTiles and click Add.
- Create another group, named (for instance) Bing.
- Add your CM93 charts, as well as all of your Bing mbTiles to this group.
- Continue adding and filling each group until all of your mbTiles are in a group.
- Finally, click [OK] in the lower right to exit the Options dialog. OpenCPN may take a moment to digest your mbTiles.
- These groups are now accessible with the numbers 1 (for your first group, ArcGIS in this example), 2 (for Bing), etc.
The first group you create will always be #1, no matter what name you give it. Once created, the order of
the chart groups can't be changed unless you delete them and recreate them, so best to think about what order
you want your charts in beforehand.
- If you always create your chart groups in the same order, you'll soon memorize that order, which will make
it much easier to switch to the map‑type that you want. We put our satellite imagery first (ArcGIS, Bing,
Google Earth) and then our marine charts after that (CMap and Navionics) but you can use whatever order you're
comfortable with.
- When you first go to a numbered group, only the CM93 will be showing. Click the magenta
"piano‑key" at the bottom of the screen to display that mbTile file.
- If the piano key is not showing, navigate to where your mbTile data should be displayed, and perhaps zoom in a bit.
- If your file is big, it might take a few seconds for it to appear. OpenCPN may appear to freeze
during this time, but it's actually thinking.
- The mbTile will stay on until you click that piano key again to turn it off. Turning it back on
usually happens without any delay.
- If you have multiple mbTiles in a group, you'll have multiple piano keys, and you'll have to turn the active one off before you can click on another one to turn it on.
- Group zero will return you to the "normal" display, with all of your mbTiles piano‑keys arrayed along the bottom, but we seldom use this anymore.
- We break our mbTiles up by country, putting separate countries into their own mbTiles. If a country is too
big for a single mbTile, then we'll break the country into areas or island groups. As a very rough rule of thumb, we find that
an area of about 10,000 sq‑nm (a 100nm square) will result in an mbTile of about 1GB. We try to keep our mbTiles
to about 3GB for a spinning disk, or 7GB for a solid‑state disk (SSD), or they can bog OpenCPN down too much.
- You'll be using a ton of disk space, as the imagery is first stored in the SAS cache, and then made into
mbTiles, so it's often stored twice. You might want to do yourself a favor and get a nice, big, SSD.
They're blazingly fast, use less electricity, and usually last longer than a spinning disk, as there's not much to
wear out. The computers we just bought aren't particularly fast, but they have 17" displays, and 2 disks, a
small SSD for the operating system, and a crappy SATA spinning disk. We then replaced the spinning disk with a
4TB SATA SSD in the 2.5" form‑factor of a laptop hard drive.
- If you load a bunch of mbTiles that are close to each other into OpenCPN, their higher altitude zooms overlap, so
OpenCPN displays a bunch of "piano‑keys" at the bottom of the screen, so you can switch between them. The
problem is that you can't easily tell which piano‑key goes with the chart you want. You have to mouse over
each key, wait for the popup, and then read through it to decide if that's the mbTile you want to display. Or
click one key, see if the image is sharp, and if it isn't, then click it again to turn it off and click another.
It's much faster and easier to merge these mbTiles into a single mbTile that covers your whole area of interest.
This will give you a single mbTile that's sharp for all of the areas that you've defined. To do this when
you're making your initial mbTiles, process all of your routes for that area at the same time and check the Merge
box in the upper‑right corner, so Sat2Chart can combine them all into a single mbTile. If you
don't use the Merge switch when you make your mbTiles, you can run the Utility Merge_MBTiles from the
Sat2Chart Utility dropdown at a later time, to merge selected mbTiles into a single mbTile.
- We've found that for satellite images, zoom‑18 gives us all the detail that we need. Many satellite
images simply don't go beyond that (and some don't even go that far in certain areas). But perhaps more to the point, trying to
stuff more detail than that into an mbTile can easily result in huge and unwieldy mbTiles. Experiment for
yourself to find what level of zoom gives you the level of detail that you want. If you feel that Zoom‑17
gives you enough detail, your resulting mbTile will be one third the size, and will take one third the
time to make. If you feel that you want the detail that zoom‑20 offers, then plan on making mbTiles that cover
smaller areas, as they'll get very big very quickly.
- When making mbTiles for OpenCPN, we've found it's best to put many zoom levels into the mbTile. We
typically put zooms 10‑18 in our mbTiles. This makes it much easier for OpenCPN to display them. It
simply looks through the mbTile, extracts the zoom level that's currently being displayed, and slams that out to the
display system. But if you leave zoom levels out, then OpenCPN has to do a lot of pixel‑fiddling to decide
what it has to display, and what needs to be thrown out. This will have a significant performance impact,
especially when panning around. Your highest zoom will be 2/3 of your mbTile, so adding lesser zooms doesn't
add much to the size of the mbTile.
- We have found that Navionics charts, especially in shallower waters, sometimes switch to feet instead of
meters, without saying anything. Navionics and CMap seem to have started with much the same charts, and
therefore, much the same soundings, as most of the differences between them are color scheme, fonts, labels, etc.
We've found it useful to have mbTiles of both, so we can check the depths against each other. If there's an
obvious 3:1 relationship, then the bigger number is probably feet, not meters. CMap seems to be only meters
(although CMap Basic seems to be feet, but we don't use that). The line where Navionics changes from meters to
feet is never marked (that we've seen) but anchoring depths are often in feet.
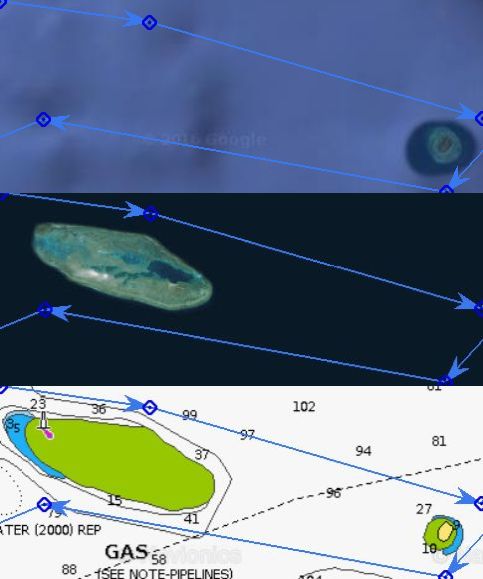
GE missed the reef, Bing missed the island
 |
- Google Earth started their project by covering the world in a purple fog, and then poking holes in that fog
where they thought there was land and buying a satellite image for that area. So just because GE doesn't show
anything does NOT mean there's nothing there. It could be hidden under the artificial purple fog. And
Google is much more
interested in land than in reefs, so some reefs don't show. Each map has its own issues (see image at right)
which is why we like to download several. And since they started with classic charts, which
can have significant errors, sometimes the hole they poked in the fog is as much as a mile away from where the
island actually is (we saw this in Triton Bay, Papua, Indonesia). ArcGIS and Bing have similar issues, but
they tend to use black rather than purple, so it's more difficult to see where the edge of their fog really is.
My point is: Just because satellite imagery doesn't show anything doesn't mean there's nothing there.
Check your nautical charts for these areas to see if there are any reefs or other obstructions nearby that the
satellite folks didn't think was worth putting into their database.
- When gathering imagery along a coast, we like to collect a bit of land, so we know where it is and what features
it offers (anchorages, marinas, river mouth shallows, bays, etc), and we like to go out to the fog, which is usually
a few miles offshore. So we draw our routes just offshore, and then tell Sat2Chart to collect imagery for 4nm
on each side of that route. This is, perhaps, a bit more than necessary, but it's better to have too much than
not to have enough. If you're careful, you can probably get away with less, which will save you download time
as well as disk space.
- If there are islands or shallows offshore, you'll have to decide if it's worthwhile to simply send your route
out over that area and back to the coast, or possibly around the island and back to the coast, or if it's better to
create a whole new route for that offshore area. I tend to favor fewer routes, so taking my current route out
to cover those offshore islands or shallows, but if they're too far offshore, or too extensive, then a separate
route is better.
- Offshore rocks or shallows are sometimes hard to see with the map you're looking at when you draw your routes.
Make sure to flip to other maps, and especially your nautical charts, often as you draw your routes, to verify that
your route is covering all the important parts that you might be interested in when you sail along that coast.
All 3 of the images at right are of the exact same area. Google (top) missed the big reef, Bing (and ArcGIS,
which often share imagery) missed the little island. Navionics got them both, but only CMap came up with a
name for the island. Both nautical charts are well positioned in this example, but that's often not the case,
so it's important to check your routes against several different maps.
I try to make my routes, and therefore my mbTiles, as if I'll have no other charts for that area, as sometimes our
only alternative is ancient paper.
- A special note about Fiji and the Aleutian Islands: Both SAS and OpenCPN have issues around
the 180 degree line. They can display imagery in the eastern or western hemispheres, but not both.
OpenCPN has gone to special lengths to display CM93 charts in both the east and west at the same time, but as of
2021 it can't do that with mbTiles. And SAS is even worse, as the current version won't even let you cross the
180º! You have to go all the way around the world to get to the other side of the 180°, which is why you also
can't make a single mbTile that spans the 180°. This is really only a problem for Fiji and the
Aleutian Islands. My recommendation is that when making mbTiles around those areas, make some for the east and
others for the west. They can go right up to the 180°, just don't cross it. Sat2Chart currently tries to
do this automatically, but it doesn't work very well and can produce large errors and poor mbTiles, so best not to
even try. Make your mbTiles for each side, load them into OpenCPN, and you'll see that (version 5.2.4) will
switch from displaying your eastern mbTiles to displaying your western mbTiles as the 180° crosses the center of
your screen.
You might want to make just one or two easy mbTiles first, just to make sure they're working the way you expect. Best
to make a linear route along a coast, as well as an enclosed route around an archipelago, where the endpoints share the
same waypoint. Run through the whole procedure, make the mbTiles, and then load them into OpenCPN and examine
them, to make sure they're
what you expect. Once you've verified that, you can start making more routes, then export them en‑mass and have
Sat2Chart and SAS Planet crank away on them all night if necessary. Once you gain some confidence, this will probably
be the most efficient use of your time, producing routes during the day and letting the computer work on several routes,
over several maps, at night.
The basic workflow is:
- Create routes in OpenCPN that go near the coastlines, and around archipelagoes and shallows.
- If you make a closed polygonal route by ending at your starting waypoint, you'll gather everything inside that route.
Make sure when creating a closed route that your final waypoint is your starting waypoint, and that OpenCPN asks
if you want to "use the nearby waypoint". If your route isn't closed, Sat2Chart will treat it as a linear
route.
- If you make just a linear route, you'll gather imagery along that route for a user‑definable distance on each side (we use 4nm).
For large islands, we'll sometimes create a linear route all around the edges of the island, but then
specifically avoid closing the route, so SAS doesn't collect all the data for the middle of the island.
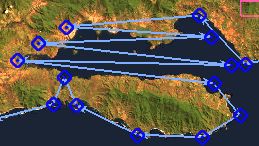
Zigzag route across a bay |
- If you're making a linear route along a coast and you come to a small area of
shallows or islands, but you don't want to stop your route and switch to a closed polygon route, you can just
zig‑zag across your shallows a few times and then carry on. Don't
cross your route, and make sure your lines are no further apart than your download width.
- I try to limit my routes to no more than a few hundred miles of coast at a time. Longer than that will produce huge mbTiles that can't be easily broken up.
- Be careful making big closed polygons, like enclosing an entire island. It can
take a LONG time to download all of that, and it can create a huge mbTile, which will be mostly the inside of
the island. For small islands, sure, download the whole thing. For islands over about 40 miles across, it's
usually best to just take the coastlines.
- Switch between satellite imagery and navigational charts now and then, to make
sure you're covering all of the areas you're interested in. Some features, like rocks or shallows, might show
up on one map but not another.
- If you work on routes for a given area, and then make the mbTiles for them all at the same time, Sat2Chart
can merge all of the mbTiles of each map into a single mbTile. This will then be much easier to use.
The mbTiles do not have to touch each other.
However, you probably don't want your final mbTile to be bigger than about 3GB for a spinning disk, or 7GB for
an SSD, or they'll take too long to load into OpenCPN.
- Give all your routes relevant names (Country.Area.S2C or something similar). Those names will be used to make the mbTiles.
- I add S2C to distinguish these routes as for Sat2Chart rather than normal sailing
routes. For closed polygonal routes, I use CS2C (for Closed Sat2Chart).
- Export all your routes individually to a working folder, one at a time (not all in the same GPX file).
- You'll also want to save them for another day, usually in folders by country or area.
- Now you're ready to Rock 'n Roll. Start SAS Planet but minimize it.
- Start Sat2Chart and tell it:
- What folder you want your finished mbTiles put into.
- If your routes are all in the same area, and you want them combined into a single
mbTile, click the Merge box. You can also do this later if you want, with individual mbTiles that you select.
- Where your routes are stored. You can select as many routes as you want in the same folder.
- This will bring up a confirmation dialog. You can add more routes if you
want, but I keep all the routes I want to make in a single folder. Click [OK], which will (eventually)
bring up another dialog so you can select:
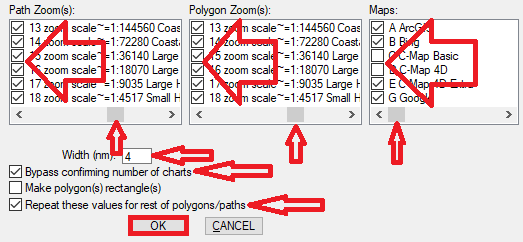
Sat2Chart Zoom and Maps Selection dialog |
- What zoom‑levels you want to download and store. Linear paths and enclosed polygons can be
selected independently, but we typically use the same zooms for both (Z10‑Z18, which lets us see individual coral heads).
- Which maps you want it to work with. We use ArcGIS, Bing, GE, CMap 4D Extra, and Navionics, but you might want to explore others like Nokia or Yandex.
Use the slider to see what other maps are offered.
- How far you want it to download on each side of your lines (we use 4nm).
- We check the "Bypass confirming number of charts" and "Repeat these values for other polygons/paths" boxes.
- Click [OK] and stand back to let it crank away!
After thinking for a while (converting your .GPX files into .HLG files for SAS) Sat2Chart will drive SAS to download all
the info into the SAS cache, then tell SAS to build mbTiles from the cache. If you're clever and have all your files for
a given area, you can click the Merge box, and it will merge all the mbTiles into a single mbTile, which will have several
advantages when displaying it in OpenCPN (you can also run Merge later if you want). Once finished with a given map, it
will switch to the next map and do the same thing. This can take a LOT of time, so I usually make my routes during the
day, and then let Sat2Chart and SAS work away during the night. Computers don't need to sleep. But don't attempt to use
your computer for anything else while it's working on mbTiles. And make sure nothing will pop up, like email or alerts.
Once you've made your mbTiles, go ahead and load the ones you're interested in into OpenCPN, and split them into chart groups,
so it's easy to switch between them. Be careful not to overload OpenCPN by forcing it to swallow too many mbTiles,
or performance could suffer. As you cruise from one area to the next, simply load up the mbTiles for the next area a bit before you get there,
and split them into your Chart Groups as above. Once you're in your new area, unload your old mbTiles (remove them from
OpenCPN) so they don't clutter your display or slow down OpenCPN.
If you just want to take a quick look at a different area, it's faster to do this with SAS, as you don't have to load/unload mbTiles.
Remember that the map shortcuts for SAS are different: A‑ArcGIS, B‑Bing, G‑Google Earth, etc.
If you have a lot of tiny mbTiles, OpenCPN will display a bunch of maroon "piano keys" at the bottom of the display. If
you mouse over them, you can see which one refers to which mbTile, but that's pretty cumbersome. Also, OpenCPN changed
the paradigm for mbTiles, and you can't just click from one mbTile to another. No. You have to turn one off before you
can turn another one on. Frustrating.
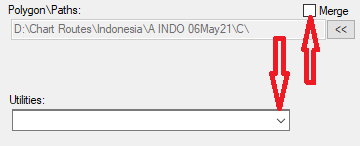
The Merge switch and Utilities selection |
So it's much easier to combine (merge) your mbTiles of a given area into a single, larger mbTile. You can do
this as you initially make them, by setting the Merge switch in the upper right corner of Sat2Chart, or you can do this
as a post‑processing operation by clicking the Utility window in Sat2Chart and selecting Merge_MBTiles. There are some restrictions
here: All mbTiles have to have the same zoom levels, and they all have to be from the same map‑type. So we'll
generally have 5 mbTiles for any given area: ArcGIS, Bing, GE, CMap, and Navionics. But making your mbTiles too big
will put a strain on the OpenCPN display engine. We've found that with an SSD, OpenCPN can display 7GB mbTiles
reasonably easily, but with a spinning disk, we try to keep them down to about 3GB each. You can use larger mbTiles,
but loading them initially might take a significant amount of time, and OpenCPN isn't good about telling you that it's
thinking. It just sort of locks up until it has finished digesting a large mbTile. Once the mbTiles have been
initially loaded, you can usually flip between them pretty quickly.
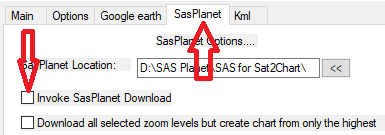
Turning off SAS downloads in Sat2Chart |
Making a few, larger mbTiles is easier to use in OpenCPN than a bunch of smaller ones, as it limits the number of piano
keys you have to wade through at the bottom of the screen. We try to have just one or possibly 2 mbTiles piano keys on
our screen at any time, by separating our mbTiles into Chart‑Groups. But sometimes,
when making our original routes, we don't know what areas those final mbTiles
will cover. So once we've downloaded all the info, and it's all in the SAS cache, we create a series of closed
polygonal routes that divide the country up into appropriately sized chunks. Then on the SAS Planet tab of Sat2Chart we
turn OFF downloads (note that this will also make Splits disappear) and run those closed polygonal routes through Sat2Chart. Since all
the data is already in the cache, all that will happen is that mbTiles will be created from the information already in
the cache, without any downloading (remember to turn Downloading back on when you're finished). This is a good way to
make sure that all of your mbTiles are of an appropriate size, yet covering all of the
coastlines you're interested in. We find this method is sometimes faster and easier than gathering our mbTiles of an
area together and merging them into a single mbTile with the Merge_MBTiles Utility, but both methods work well.
Everyone will have their own ideas about this, but here's a starting point. Folks will probably be generating a LOT of
data, first for the SAS cache and also for mbTiles for OpenCPN. SAS will organize its cache, but you want to keep your
mbTile charts, and the routes that generated those charts, organized so you can find them easily. Our mbTiles for just
the Philippines are over 100GB, and Indonesia is even bigger.
| Root |
Type |
Country |
Area |
Comments |
| D:\Charts\ |
mbTiles\ |
Singapore\
Indonesia\ |
Komodo\
Raja Ampat\ |
Small, no area needed
Many areas needed for Indonesia |
| D:\Charts\ |
KAPs\ |
Thailand\ |
West\ |
We now use mbTiles, but we still have KAPs |
| D:\Charts\ |
Routes\ |
Malaysia\ |
Borneo\
PeninsulaW\
PeninsulaE\ |
Includes Brunei |
| D:\Charts\ |
CM93\ |
2007\ |
|
Several years available until 2011 for V2 |
While it's not at all necessary, we like to keep our operating system (OS) on one (small) disk, and our data on
another. Never split up a disk to accomplish this, as that will just cause you to run out of disk space sooner, without
improving your safety or flexibility. If you want your data and OS on separate drives, use 2 separate physical
disks. Solid‑state disks (SSDs) are much faster, which will help a lot when trying to feed OpenCPN several large
mbTiles. Our laptops came with a small SSD for the OS (C:\), as well as a spinning disk for our data (D:\), which we
replaced with a 4TB SSD in a 2.5" laptop hard‑drive form factor. This way we can upgrade our data drive as SSDs get
bigger and cheaper. If you don't have a second drive, substitute C: when we say D:.
We keep our charts divided by country and then area (if the country's big). We also keep the routes we used to generate
our charts, as sometimes we need to update them, or maybe make new mbTiles from them. We keep our mbTiles of different
maps for the same area in the same folder, as OpenCPN can sort them out later. Our structures for our Routes, mbTiles,
and KAPs are very similar to each other.
Making good mbTiles requires a LOT of time and internet bandwidth. It would be terrible to lose all of that if/when a
disk fails, and it has happened to us, costing us all of our photos of Chagos and the western Indian Ocean. We've
bought a pair of 5TB USB drives, and use them to back up all of our chart data (as well as our SAS cache, photos,
documents, etc). Keeping all of your chart data in just a few areas makes this easier.
While satellite imagery doesn't have depths, a practiced eye can often tell depth by color of water, and color will
often tell you where the sand is for anchoring, as it looks white or light blue, while coral is usually brown. But we
also make mbTiles with CMap and Navionics. These aren't as accurate as satellite imagery, but they do have depths,
which are usually reasonably accurate. And switching between maps requires only a single keystroke in either OpenCPN or
SAS Planet.
Jon's email address (hidden from spiders) |
Ever since cruising buddies went up on a reef in Indonesia in 2015, just from trusting their Navionics charts too much,
we've been on a mission to get our more accurate charts to as many cruisers as possible. Their insurance refused to pay, so all we
could do was to strip their boat of anything valuable. We don't ever want to have to do that again.
If you're making high quality mbTiles, covering multiple maps and zoom levels, and you'd like to share them with the
cruising community, we'd love to talk to you! We share ours, and we're trying to become a repository of high quality mbTiles for the
cruising community. If you'd like to contribute, we'll make sure you get full credit, with links back to your website.
Also, of course, if you have questions or comments about this page, please
contact us. Don't be shy! The only silly question is the question not asked. We'd love to hear what you have to say.
And Good Luck!
Is this useful? Buy us a beer!  |
|
Please remember to read the HELP before asking for support in these forums.
OpenCPN help is provided via their very thorough
Online User's Manual.
Support is provided on the Cruisers Forum OpenCPN Help/FAQ
page by several good people. Anyone can read the posts, but you have to be registered to make a post
of your own. Registration is free, but requires an email address, which is never shown to others.
Sat2Chart Help is provided via the big Help button in the lower left. The help files are all in
a Help folder, under where Sat2Chart is installed. Support is provided on
Facebook
as well as Cruisers Forum.
Paul monitors both pages and usually responds pretty quickly. For technical issues, you can email Paul
directly. His email address is at the top of the Help. If you can send him screenshots of problems, as well as the
Sat2Chart.Log.txt logfile from the Sat2Chart folder (the logfile should be zipped if possible) then you'll get better results faster.
SAS Planet has its own support forum, but it's all in Russian. Google Translate is pretty good with Russian, but
you might get better luck by posting your question on the Sat2Chart (GE2KAP) Facebook page,
since all of us there are using SAS. Note that this page is now private, so you'll have to email or message Paul for access if you're not already a member.
These are for more experienced users. From here down to the bottom isn't really necessary for making mbTiles.
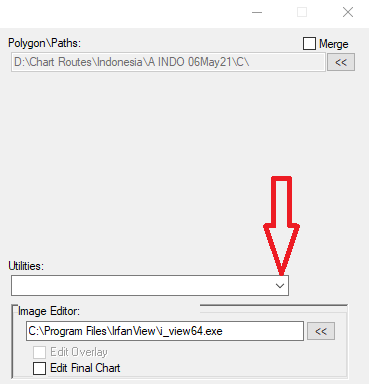
Sat2Chart Utilities Selection |
- Sat2Chart Utilities: Sat2Chart provides several useful utilities, via the
Utilities window on the right. Click the down‑arrow at the right end of the box to see and/or select one of
the utilities. These are explained more fully in the Sat2Chart Help, but a brief description is
provided here so you know what's available. Sat2Chart comes with an image editor (View.exe) or you can use your own
editor, as long as it can edit .PNG, .JPG, and .BMP files. As of June 2021, the supplied utilities include:
- Edit Chart: Allows editing the chart image with an image editor, to enhance colors, add text, etc.
- MbTiles Viewer: Displays selected zoom levels of an mbTile in the image editor.
- Merge MbTiles: Combines (merges) several mbTiles into a single mbTiles file.
- Extract High Zoom: Pulls out the highest (most detailed) zoom‑level from an mbTile.
- Create New Cache: An experimental way to convert the SAS Cache done
entirely by Sat2Chart, with no SAS involvement. At present, it's still significantly slower than SAS doing the
conversion itself, but it can pull out just certain areas.
- SAS Planet Cache Viewer: Will display where in the world you have cached tiles.
- Convert Cache: The fastest way to convert your SAS Cache from one format
to another, usually from the default individual tiles to SQLite databases. Afterwards, you'll have to go into
the SAS Settings/Options/Cache tab and reset your Default Cache Type to your new type. If you have a fast
hard‑drive, this utility will let you run multiple instances of SAS, to convert different maps in parallel. But
look at your Task Manager to make sure you don't swamp your disk. 2‑3 instances should be fine for a SSD,
1‑2 for a spinning disk. Also, remember to turn off your Defender (or other anti‑virus) Live‑Scan, to improve
performance. If you're still using the original default cache, we strongly recommend that you convert to an SQLite cache.
- C2GPXKML: Converts many file formats to GPX or KML format
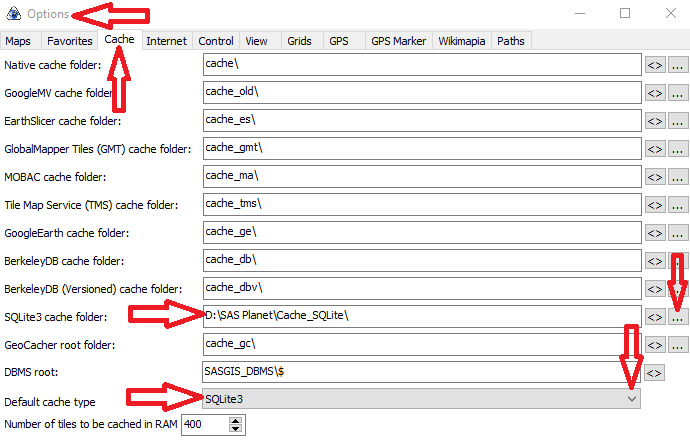
SAS Planet Cache Options dialog |
- Converting Your Cache to SQLite: SAS originally kept its cache as individual
"tiles" (usually small .png graphics files) on your hard drive, organized by zoom level and lat/lon. This was
extremely simple, and offered some fun tricks like being able to merge (share) caches with friends. But the number
of files soon gets too big to manage easily, or even backup. Therefore, we now recommend that everyone use the
SQLite database‑based cache. Since this format saves several hundred tiles in each SQLite database, the number of
files goes down significantly, making them much easier to copy or backup. Also, while the absolute size of the data
gets very slightly bigger (some meta‑data is saved in the databases), the bigger files can be saved much more
efficiently on the disk, resulting in about 12% savings in disk‑space. SAS provides a utility to convert one form
of cache to another, but Sat2Chart provides a better version, the Convert Cache Utility, which essentially wraps the SAS functionality in a better
user interface to automate the process. Once your cache has been converted, open Settings/Options, go to the
Cache tab, and set your cache type (near the bottom) to SQLite3, and tell it where your SQLite3 cache is located.
Note that the version of SAS on Paul's website is already set to SQLite3.
- Running Multiple SAS Versions: Since SAS Planet isn't really installed, just
unzipped, you can have multiple installations on your computer, and even have multiple instances running at the same
time (but better not to do this while Sat2Chart is running). As of 2021, Paul is using a relatively old and
untested ("nightly" build) version for downloading and making mbTiles. But newer, better tested versions are
available and can also be used. It's just that they haven't been tested with Sat2Chart. We typically have at least
2 versions installed, one in D:\SAS Planet\SAS_for_Nav and another in D:\SAS Planet\SAS_for_Sat2Chart.
Both versions have their caches pointing to the same cache, D:\SAS Planet\Cache_SQLite, so that downloads made with Sat2Chart are also available to
our navigation version. To do this, in EACH of your SAS instances, go to Settings/Options, select the Cache tab, and set your SQLite3 Cache folder
to point to your shared cache location (probably on the same level as your SAS installations).
We like to right‑click on the SasPlanet.exe executable file and pin it to our taskbar, so it's easy to start
again. To give them different names, so you can tell them apart when you mouse over the taskbar icons, you have to
edit the shortcuts. Go to:
C:\Users\[UserName]\AppData\Roaming\Microsoft\Internet Explorer\Quick Launch\User Pinned\TaskBar
Find your Sas Planet shortcut(s), right click on them, and select Properties. Note which folder that shortcut is for
in the Shortcut tab, and then switch to the General tab. Edit the name to be whatever you'd like, to distinguish it
from other SAS's that you might have installed, and then click [OK] at the bottom to save your changes. For
instance, you might name one SAS for Nav and another SAS for Sat2Chart. What you fill in on that
General tab will be what you see when you mouse over the icon. Although they have the same icon, mousing over them
will tell you which is which. We also separate them so SAS for Nav is next to our OpenCPN, and SAS for Sat2Chart is
next to our Sat2Chart (just drag the icon on your task bar). When sailing, we'll often have both
SAS for Nav and OpenCPN running side‑by‑side, with a COM‑port splitter so each gets the GPS signal.
- Latest SAS Version: To download the latest released (tested) version of SAS Planet,
go to http://www.sasgis.org/,
wait for your browser to translate the page from Russian, and then download the latest version and unzip it wherever
you want. This version doesn't know how to download any maps yet, so go to the Maps folder and run the Update.cmd script
to download this information. You might then want to unzip the C-Map_V2.zip file
in the Maps folder to add CMap functionality.
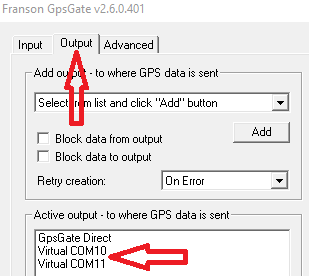
GPS Gate setup dialog |
- Sharing GPS data: GPS data typically comes into your computer over a serial (COM) port. Even
if it physically comes in through a USB port, internally the computer converts that to a serial signal coming in
over a COM port. But one of the limitations of Windows is that a serial stream can only go to a single
application. So we downloaded a small application that reads a serial stream and then outputs it over as many
virtual COM ports as you like. So it reads our GPS data (actually our AIS data, which contains GPS data)
coming in over a hardware port, and then spits it back out over a pair of virtual COM ports, so OpenCPN can read one
of those, and SAS Planet can read the other. This lets us run both applications side by side, with a single
GPS stream going to both applications. In theory, OpenCPN has this ability built into it, where it can read
the GPS info and then spit it out over a different COM port, but we've never gotten it to work, so we got the
serial‑port splitter software several years ago. We use
Franson GPS Gate, but Google will point out
several others if you search.
- C‑Map Chart Data: The way to access CMap information changed in about
May 2021. Some versions of the Maps info don't include CMap. Paul's version of SAS should already
have CMap maps, but if you're using a different version that doesn't have CMap and you want to add CMap to your list
of downloadable maps, download C-Map_V2.zip from
Paul's server and
unzip that in the Maps folder. This will provide access to 5 flavors of CMap data: 4D, 4D‑Extra, Basic, Basic HBR,
and SeaFloor. SeaFloor doesn't have depths per se, but it paints the bottom in different colors depending on the
depth. Basic HBR is much like the Navionics SonarCharts, with LOTS of contour lines rather than depth
numbers. Basic is very basic, and the depths seem to be in feet. 4D and 4D‑Extra seem to be very similar, except
that the Extra has a tiny bit more information, like wrecks. These last 2 seem to be the best CMap maps. If the
cache folders don't exist, SAS will create them the first time you use that map.
- Preserving Old CMap Data: If you have old CMap data from before about
May 2021, you may want to copy your old CMap cache to a new location, so you can still access that information. You can copy
(or move) your old CMap cache to any of the new CMap caches with just Windows Explorer. We copied ours to the 4D‑Extra cache,
as that's the one we'll be using the most. But remember that SAS won't usually overwrite information that it
finds in its cache unless you tell it to explicitly.
- Shortening CMap name: The CMap file provided by Paul gives each CMap map a name like:
C-Map_4D (https://maps.c-map.com/index_pc.htm)
Normally, this wouldn't matter, but it turns out that Sat2Chart puts the whole CMap name into each mbTile that it
creates, which results in mbTile filenames like:
Indo.Komodo.C-Map_4D (https://maps.c-map.com/index_pc.htm).Z10-Z18.mbtiles

Params.txt file - Remove the green parts |
This is a bit ridiculous. SAS needs the URL to access the CMap information, but there's no reason for it to be in
the name (or in the mbTile) as well. So we've edited the names of each of the 5 CMap definitions so we get mbTiles
names like:
Indo.Komodo.C-Map_4D.Z10-Z18.mbtiles
This is much more manageable and readable. To do this yourself, go to your SAS Planet maps\C‑map folder. Under
that are 5 c‑map folders. In each one, edit the params.txt file to remove the URL from the name=, name_en=,
and name_uk= lines at the top of the file, and save the file. Don't change any lines except those 3.
- Adding More Maps to Sat2Chart: In the Sat2Chart folder, the Sat2Chart_Selected_Maps.txt file
defines the shortcuts used to access commonly used maps in SAS. There's a Sat2Chart_Selected_Maps_Sample.txt file provided, which is what is built into
Sat2Chart. If you want to add other maps to what Sat2Chart offers, remove the _Sample from the filename, and Sat2Chart will use what's
in that file, rather than its internal list.
To add or remove maps on this list, or
change the shortcuts, create the shortcuts in SAS, usually through the Settings/Map‑settings dialog (see below), and then edit
the Sat2Chart_Selected_Maps.txt file with any text editor (like Notepad) to add or modify the entries with their shortcuts.
Then they'll be offered as options when selecting which maps to use the next time you restart Sat2Chart. Note that these
modified shortcuts may disappear and have to be reapplied if you update your Maps in SAS with the Update.CMD file,
as the shortcuts in SAS are defined in the Params.txt files.
We find the default shortcuts for CMap to be non‑intuitive, so we use the following shortcuts:
CMap Basic (C), CMap 4D (D), CMap 4D Extra (E), CMap SeaFloor (F). We don't use CMap BasicHBR so we don't give it a shortcut.
To change a single shortcut in SAS, go to Settings/Map Settings/Cache and Other, and set the Hotkey. Note that
there's no check to see if this hotkey is already defined (which may result in unpredictable operation).
To change multiple maps' hotkeys, go to Settings/Options/Maps tab. Double click on the map you want to change and
select Cache and Other, then change the hotkey. You can then repeat this for as many maps as you'd like. But
remember to edit your Sat2Chart_Selected_Maps.txt file in your Sat2Chart folder to match the shortcuts that you set in SAS.
If you want to learn how to make mbTiles directly, with just SAS Planet, here's an example. This is essentially what Sat2Chart does.
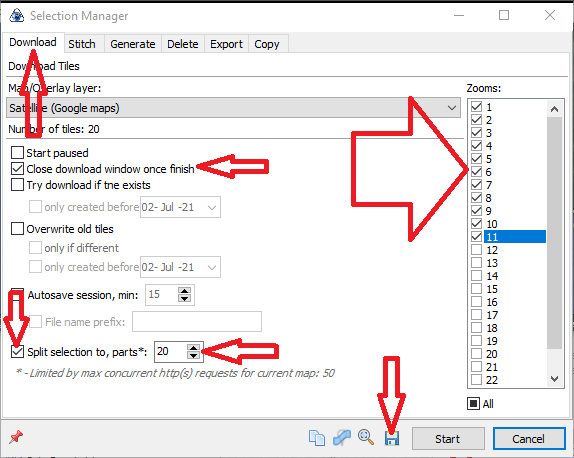
Selection Manager Download Tab |
- Start SAS Planet, select your preferred map (ArcGIS, Bing, etc) and navigate to your area of interest.
- Select Operations/Selection Manager/Polygonal selection (Alt‑P).
- Start clicking on the map to outline your area of interest. SAS will start drawing a polygon after your 3rd point.
(Sat2Chart creates a closed route .HLG file from your .GPX file for this part, and just feeds the file to SAS Planet.)
- Once you've finished your basic polygon, you can correct and improve it.
- If you click on a point, you can drag it to a better position.
- To add a point, click on the point BEFORE it and then click on the line. This will create a new point that you can drag to wherever you need it.
- To delete a point, select it and then click the delete‑point (leftmost) icon on the little floating tool‑bar.
- Use your mouse wheel to zoom in/out. To pan around, RIGHT‑click the map and drag it.
- You can check your selection against other maps if you want, but be sure to end on the map you want to download.
- Once your area is enclosed correctly, click the check icon (rightmost) in the small floating tool‑bar.
This will bring up a Selection Manager window to download the tiles (imagery) to the SAS Cache (see
Download image at right). Select the
Download tab, far left, if it's not already showing.
- Save your selection with the disk icon on the bottom. Give it a useful name. It will get saved as an .HLG file.
- Check what zoom levels you want. For high‑altitude overviews, I usually select
zooms 1‑12, but for detailed navigational mbTiles I use zooms 10‑18. I also check
"Close download window once finished" and "Split selection to parts" which I set to about
20, depending on the quality of my internet connection (more for better).
- If SAS won't let you use as many "splits" as you want, go to Settings/Map‑Settings
(Ctrl‑Alt‑P), Internet, and crank the "Max concurrent http requests" up to some high value like 50. Then hit
[OK] and go back to the Selection Manager (Alt‑P).
- Click Start and several small windows will pop up and start downloading tiles to the cache. Wait until they're finished.
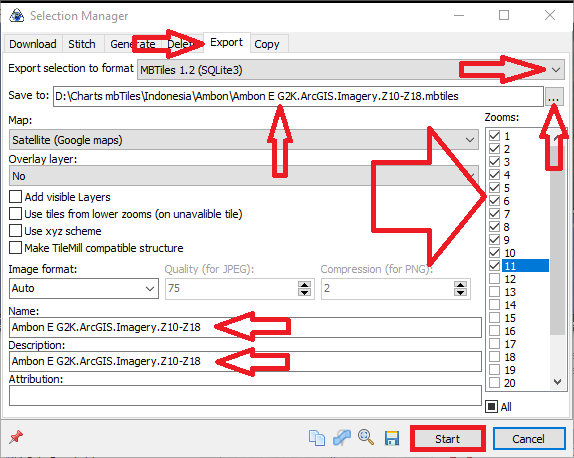
Selection Manager Export Tab |
- When the download windows have all finished (disappeared) hit Ctrl‑B to bring up the last selection
(or Operations/Selection Manager/Last Selection), and click the Export tab (see image at right).
- Under Export selection to format, click the dropdown and select MBTiles 1.2 (SQLite3) near the bottom.
- Select the same zoom levels as what you downloaded (for example, Z1‑12 for overviews, or Z10‑18 for navigational mbTiles).
- Click the 3 dots at the end of the Save To and select a location and name for your
mbTile. It's a good idea to use a common format for all your mbTiles like: [area].[map].[zoom‑levels]. For
example: Philippines.ArcGIS.Z1‑Z12.mbtiles for a high‑level mbTile, or Komodo.Bing.Z10‑Z18.mbtiles for a detailed mbTile.
- Fill in the Name, Description, and Attribution if you want. We make the name and description the same as the filename.
This part isn't really necessary.
- Click [Start] to create the mbTile.
- Switch to another map, Ctrl‑B to bring up the last selection, switch back to the Download tab, and repeat
#7‑10 for any extra maps you may want. We typically use ArcGIS, Bing, GE, CMap, and Navionics.
- Now tell OpenCPN to load those mbTiles (Settings/Charts, add). If the location has already been added earlier,
then check the "Scan Charts and update database" box and click [OK].
- You'll also probably want to break your mbTiles into Chart Groups so you can
switch between them with a single keystroke.
Equipment Pages:
Chart Downloads | Making mbTiles | KAP Files | OpenCPN | Turnbuckles | LEDs | Anchors | Sail Drives | Epoxy Work | AIS | Solar Panels | Watermakers | 3G Modems
Cruising Info:
Up | General Cruising Info | Pacific Ocean Cruising | Indian Ocean Cruising | Provisioning Food & Fuel | Cruising Recipes
Top Level:
Home |
Destinations |
Cruising Info |
Underwater |
Boat Guests |
Ocelot |
Sue |
Jon |
Amanda |
Chris |
Site Map |
Make a Comment
 |
Lifetime
Commodores
of the
Seven Seas
Cruising
Association |
 |
|
If our information is useful,
you can help by making a donation
|
Copyright © 2000‑ Contact:
Jon and Sue Hacking -- HackingFamily.com, svOcelot.com.
All rights reserved.


